
Power BI Template File: Fast Setup Guide
If you prefer to use a preconfigured file, you can import the Alvys Public API.pbix file, which contains all the latest queries, parameters, and sample reports to get you started quickly.
Download: Alvys Public API.pbix
Steps to Get Started
-
Download and Open the File:
- Download the
Alvys Public API.pbixfile from the link above. - Open it in Power BI Desktop.
- Download the
-
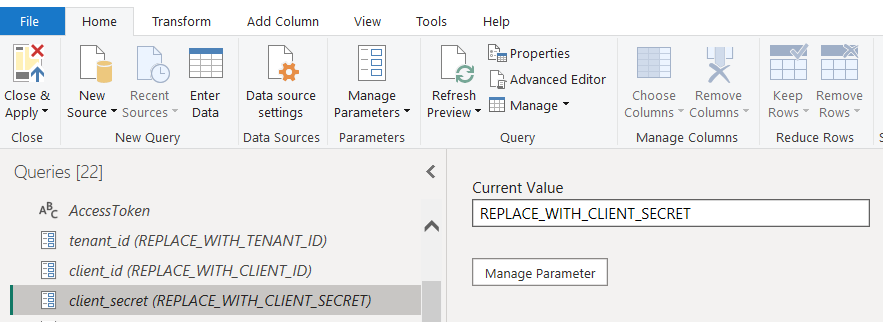
Update Connection Parameters:
-
Click on Transform Data from the top menu.
-
In the Transform Data view, go to Manage Parameters or select the parameter rows in the query list.
-
Update your
tenant_id,client_id, andclient_secretwith your organization’s credentials (required for new Authentication flow).
Note: Only newly generated credentials—with proper API scopes—are allowed in the new authentication flow. Legacy credentials will not work. -
(The legacy authentication method will no longer be supported soon.)
-
-
Authenticate and Refresh:
-
Select the
AccessTokenquery and ensure a token is returned. -
If prompted, click Edit Credentials, choose Anonymous, and click Connect with new endpoint
https://auth.alvys.com/oauth/token.
Troubleshooting Authentication- Click on the AccessToken query.
- It should retrieve the authentication token automatically.
- If you see an "unauthorized" error or are prompted for credentials:
- Click Edit Credentials
- In the window that opens, select Anonymous authentication.
- Confirm and click Connect.
- After connecting, try refreshing the query again.
- Click Edit Credentials
-
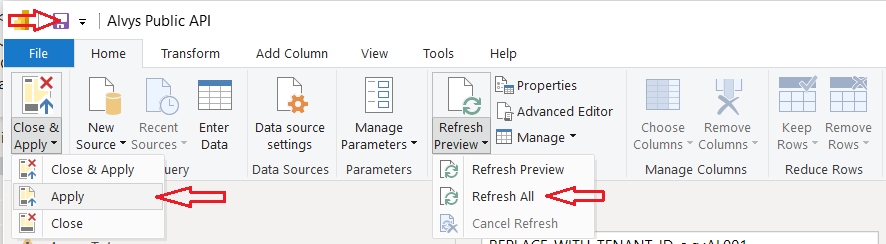
In Power Query, use Refresh Preview > Refresh All to refresh all queries with the new token and updated credentials.
Troubleshooting:If you see a “Formula.Firewall” or privacy error, go to File > Options and settings > Options > Privacy, and set to “Ignore the Privacy Levels.” This allows Power BI to combine data from multiple queries.
-
-
Enable and View Data:
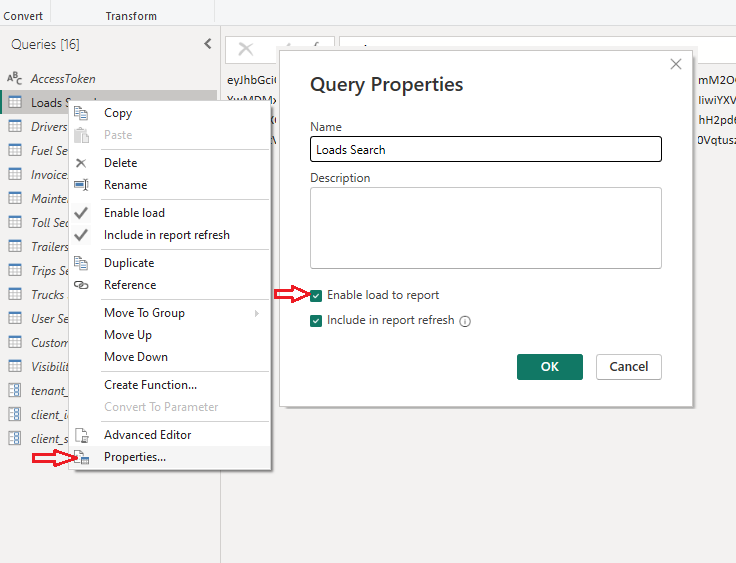
- In the Queries list, right-click any query you want to include in the report (e.g., Loads, Users, etc.).
- For Loads and Trips, you will see multiple queries (e.g., 1 Loads - Search ALL, 2 Loads - Get Recent Updates, 3 Loads).
- Important: Only the “final” combined query (usually 3 Loads or 3 Trips) should be enabled for load to the report. The “1” and “2” queries are used for data processing and should remain disabled after initial data validation.
- Tip: If this is your first time setting up, you can temporarily enable the “1” and “2” queries to check the data. Once everything is working, disable them to keep your model clean and fast.
- Right-click and select Enable Load to Report (or go to Properties and check "Enable Load to Report") for the queries you want visible in the report.
-
Apply Changes:
- Click Close & Apply in Power Query or go to File > Apply Changes.
-
Explore Your Data and Reports
-
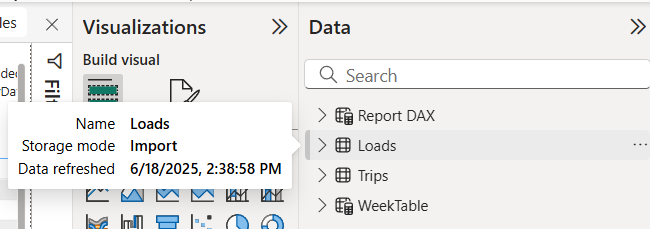
In the Data view (left sidebar), you’ll see all your loaded tables along with a “DAX Report” table containing basic DAX formulas—these are included to help you quickly analyze or summarize your data.
-
In the Report view (top icon on the left), you’ll find a sample weekly summary visualization and other quick-start report pages—these give you an instant overview and examples for analyzing your customer data.
-
To view your data, click any table in Data view to see all fields and records—then sort or filter columns directly to explore, check for errors, or find specific information; tip: sorting and filtering make it easy to spot updates or issues.
-
In the Model view (bottom icon on the left), you can review or adjust relationships between tables.
Tip: For accurate analysis, make sure to set a relationship between Loads (1) and Trips () using the LoadNumber field.*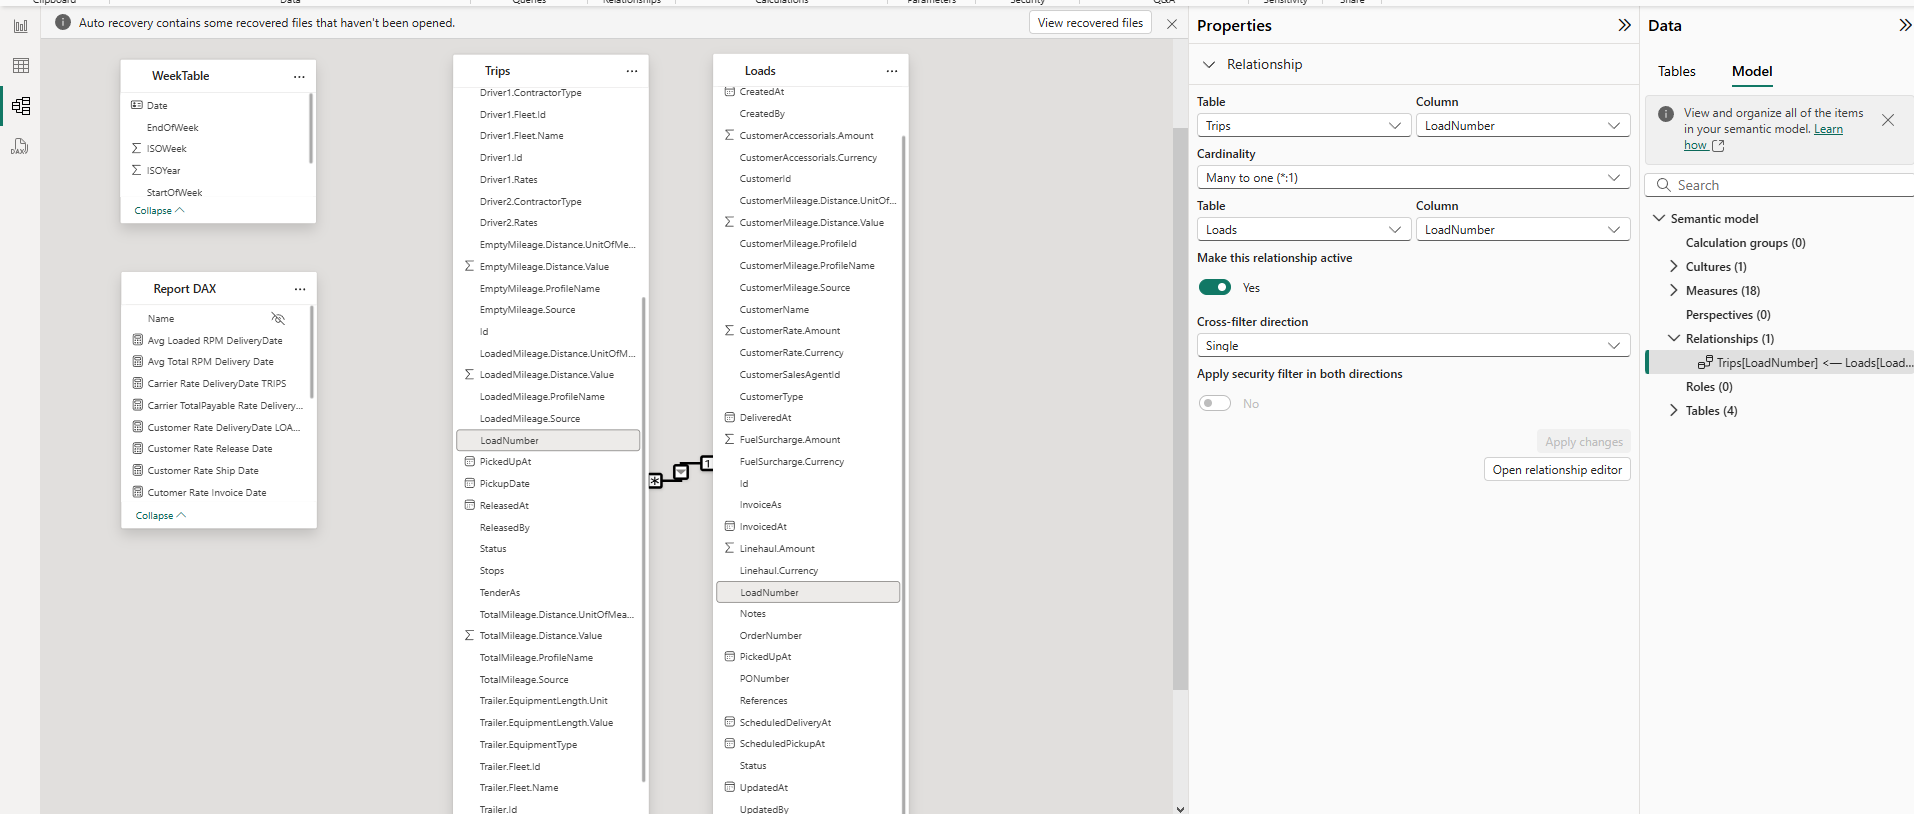
-
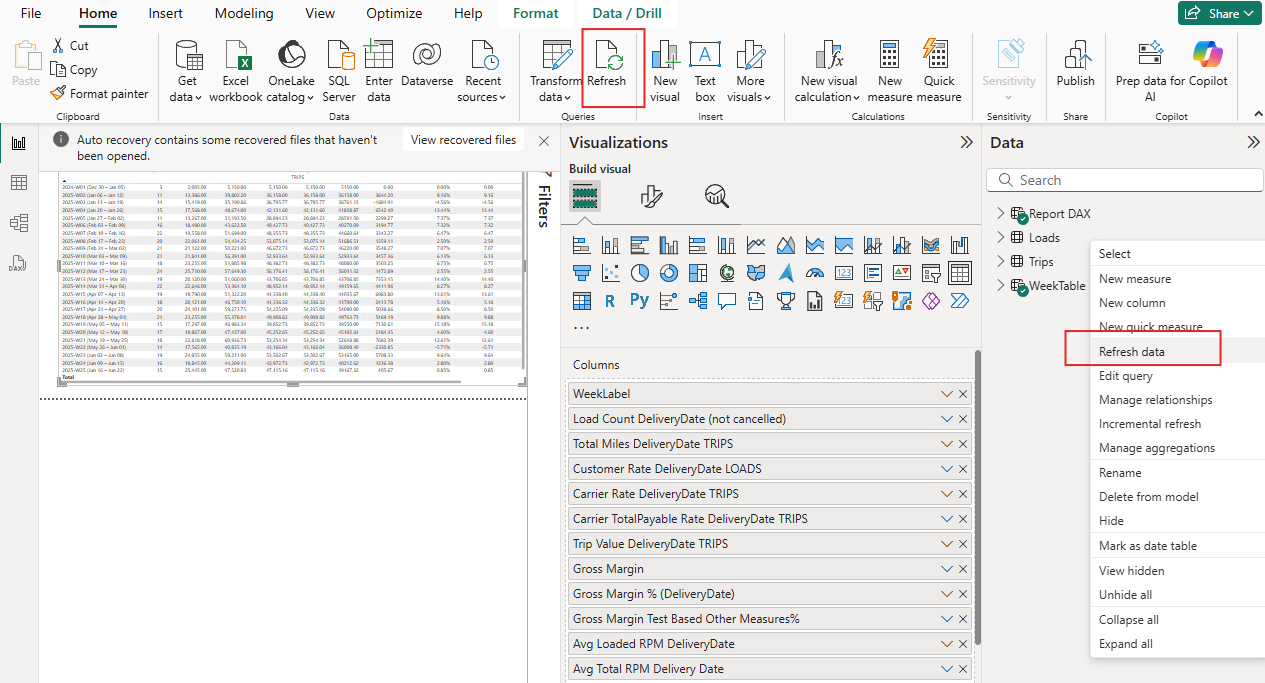
To update your data, go to Data view and click the three dots (...) next to a table to select Refresh data, or use Refresh all tables from the main menu to update everything; tip: refresh regularly to ensure you see the latest API data and parameter changes.
-
For more details or troubleshooting, see the instructions inside the file or contact your support team.